The Hund Blog
How to Make an Automated Status Page with Hund
In this blog post, I will discuss the benefits of having an automated status page, and then guide you step-by-step to setting up your very own automated status page using Hund.
Having a status page makes it easy to communicate with your users when downtime occurs. When things are running smoothly, they also act as a log of historical uptime and recent performance, affording your company excellent transparency with minimal effort.
Of course, there is a multitude of great status page providers: from the ever-present StatusPage.io, to open source projects like Cachet. However, a status page is only as good as the information it displays, and manually updating your service status when problems arise creates a lag between the time the problem occurred and the time at which it was reported. This could lead to frustrated users that cannot connect to your service but see a status page reporting that everything is okay.
To reduce this lag to mere seconds, Hund provides automated Components that regularly poll your services (via Pingdom, Updown.io, and others), and report downtime as soon as it occurs, which can then alert your users immediately via Hund's notifiers.
If you want to follow along, sign up for a 30-day free trial at Hund (no credit card required).
In this tutorial, we will set up a simple automated status page using Updown.io. We also support watchdogs such as Pingdom, AWS Cloudwatch, webhooks, and others which you could use here instead of Updown.io.
Step 1 (optional): Set up the Updown.io Watchdog
This step isn't required, but configuring global settings for the Updown.io watchdog makes it easy to set up future Components. To do this, click the "Watchdogs" tab on the Hund dashboard, and then click the "Configure" button underneath the Updown.io logo. You will see a form to enter an Updown.io API key.

Create an API key on Updown.io and then enter it into the field labeled "API Key," and then press the "Update Global Watchdog Setting" button to configure the watchdog.
Step 2: Create a New Group and Component
Components are the pieces that make up your business or platform, such as a search API, database, payment processor, or a physical location. These can be affected by downtime or other service interruptions.
To create a new Component, we will need a Group to put it in first. Click on the "Components" tab on the Hund dashboard and then click "+ Group". Name your Group and click "Create Group."

Now we can create our Component. Click on "+ Component" and then "New Component" under the Updown.io logo. Here, you can set a name and description for the service that this Component represents and will be monitoring. Moreover, you can set your Updown.io API key, along with the monitor token that represents your service on Updown.io. If you followed Step 1, this should be easy as your API key is already set, and Hund automatically puts all your Updown.io monitors into a tidy list!
When you've configured your Component to your liking, click the "Create Component" button, and voilà!

Step 3: View Your Status Page
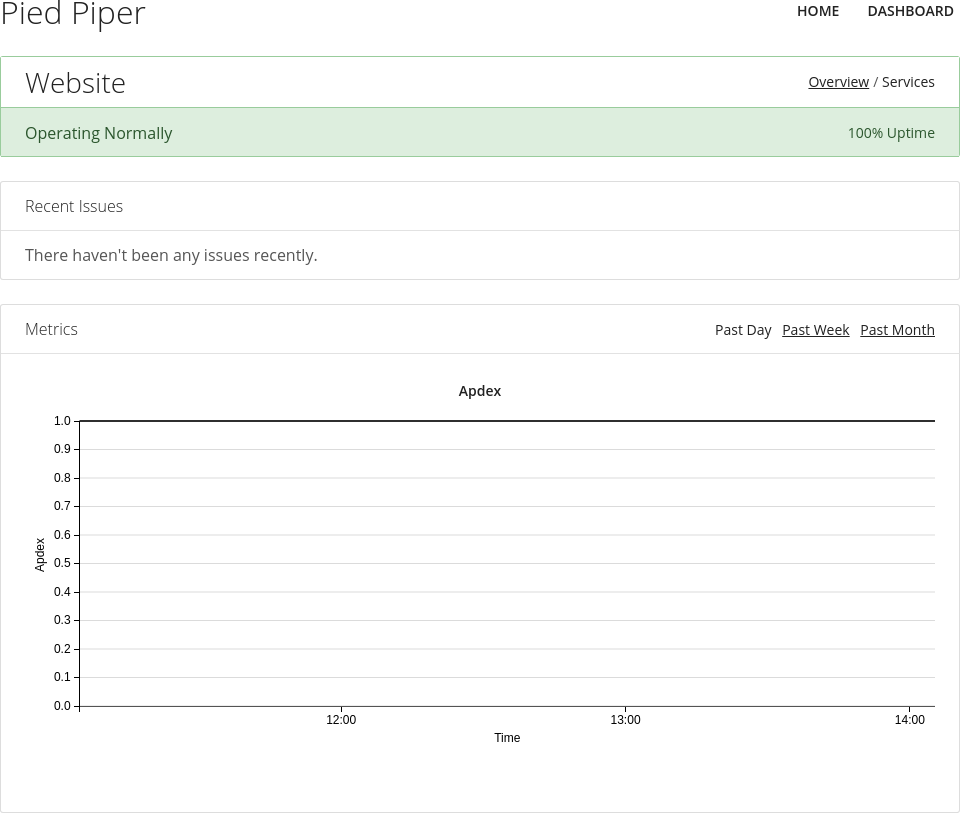
Now you can click on the "Home" link at the top of the page to see your brand new status page. The Component might have a "Pending" status for a minute or so, but soon after Hund will update its status using Updown.io or the watchdog of your choice. Remember to refresh!

Click on the Component to view more information including relevant metrics that are automatically logged by Hund.
Creating automated Components is simple with Hund, and allows you to focus on fixing downtime, while we do the work of reporting and monitoring service interruptions.